


Published Friday, July 10, 2020, 7:03 p.m.

The Standard & Poor's 500 stock index surged 1% today on positive news about a coronavirus treatment.
The S&P 500 roughly tracks with the progress of civilization, but progress is unpredictable and hard to see one day at a time.
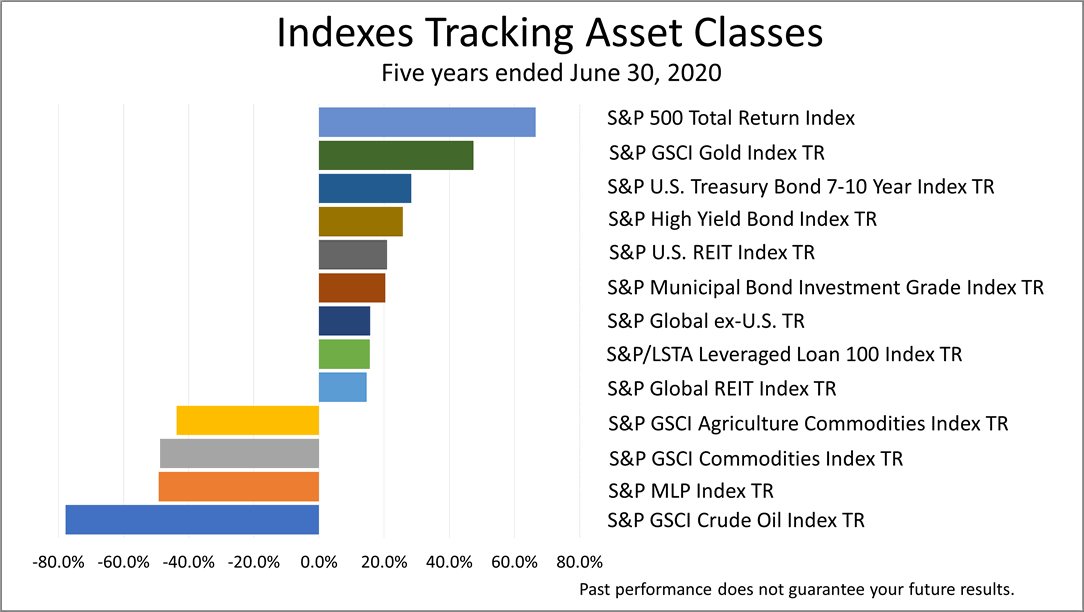
Here's a snapshot depicting progress from a longer-term perspective: For the five years through June 30, 2020, the S&P 500 was No. 1 among the broadly diversified group of 13 asset classes listed here. Three months after the Covid crisis began, the U.S. stock market topped this long list of securities investments with a total return over the five years of 66.5%.
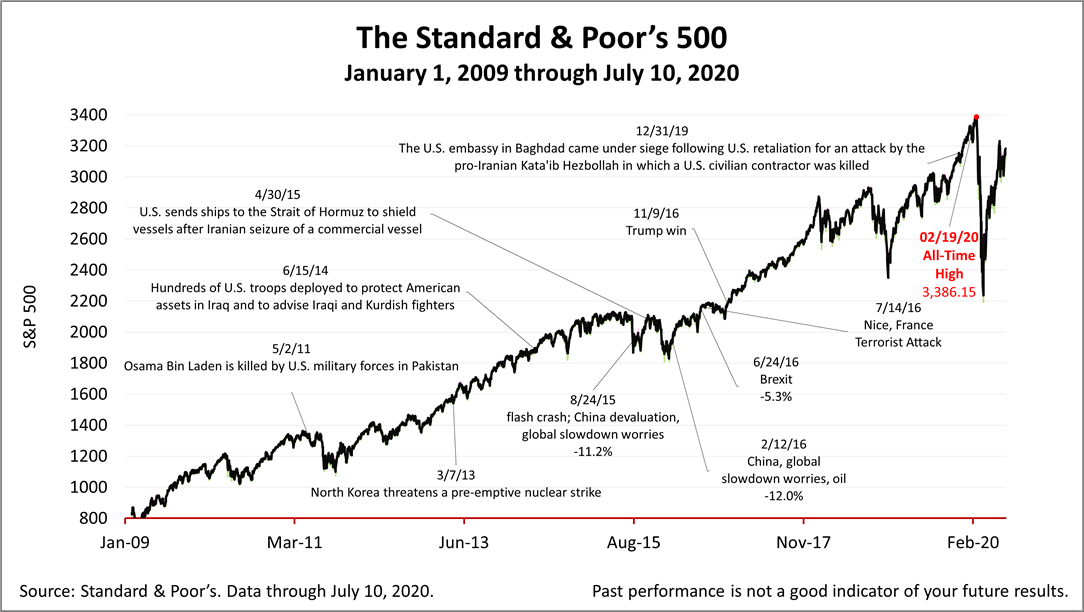
Closing Friday at 3,185.04, the S&P 500 posted a 1.74% gain over last week. It's up 35% from the March 23rd Covid-crisis bear market low.
On Thursday, the S&P 500 sent a bullish technical signal called a "golden cross," which has marked the end of previous bear markets. In addition, the index's 50-day average crossed above the 200-day average, another sign of strength.
Stock prices have swung wildly since the virus crisis started in March and it's wise to expect considerable volatility in the months ahead.
Nothing contained herein is to be considered a solicitation, research material, an investment recommendation, or advice of any kind, and it is subject to change without notice. It does not take into account your investment objectives, financial situation, or particular needs. Product suitability must be independently determined for each individual investor.
This material represents an assessment of the market and economic environment at a specific point in time and is not intended to be a forecast of future events or a guarantee of future results. Forward-looking statements are subject to certain risks and uncertainties. Actual results, performance, or achievements may differ materially from those expressed or implied. Information is based on data gathered from what we believe are reliable sources. It is not guaranteed as to accuracy, does not purport to be complete, and is not intended to be used as a primary basis for investment decisions.
This article was written by a veteran financial journalist based on data compiled and analyzed by independent economist, Fritz Meyer. While these are sources we believe to be reliable, the information is not intended to be used as financial advice without consulting a professional about your personal situation. Indices are unmanaged and not available for direct investment. Investments with higher return potential carry greater risk for loss. Past performance is not an indicator of your future results.
 Despite Bad Economic News, Stocks Rose 4% In The Week Ended July 29, 2022
 Amid Bad Data Releases, Leading Economists Predict No Recession
 Good News: Real Retail Sales Dropped Fractionally In The Past Year
 Financial Economic News Analysis
 Odds Of A Soft Landing Shrunk After Friday's News
 Bad Inflation Surprise Sends Stocks Down Sharply
 It Could Be A Long, Hot Summer For Investors
 What A Difference A Week Makes
 Amid Stock Market Turmoil, +2.3% Growth Projected In 2022
 Staying On Track Amid The Ukraine And Inflation Crises
 For Investors, 2022 Is Turning Into A Test
 Is The Economy Brightening? Or Is The Federal Reserve Slamming The Door On Growth
 Perspective Amid A Moment Seeming Fraught With Investment Risk
 Two Years After The Pandemic Began
 Turning The Page On A Dark Period In History
 Russia-Ukraine War Erupted And Inflation Worsened But Outlook Drove Stocks Higher For The Week
 Investment Perspective Amid Risks Of Fed Tightening, Covid Variants, And European War
 S&P 500 Lost -1.9% Friday; Latest U.S. Economic Data Are Strong
 January Job Formation Figures Crushed Expectations, Amid A Shortage Of Workers
 S&P 500 Closed Up 2.4% Friday After A -10% Correction
 Stocks Declined Sharply, Even As Economists Expect 3% Growth In 2022
 Should You Care About Wall Street Stock Market Predictions?
 Weekly Economic Update For Investors

Not found any published videos!

Jericho Atrium, 500 N Broadway # 219
Jericho, NY 11753
Phone: +1 516-935-3434
Fax: 516-935-3454


")


